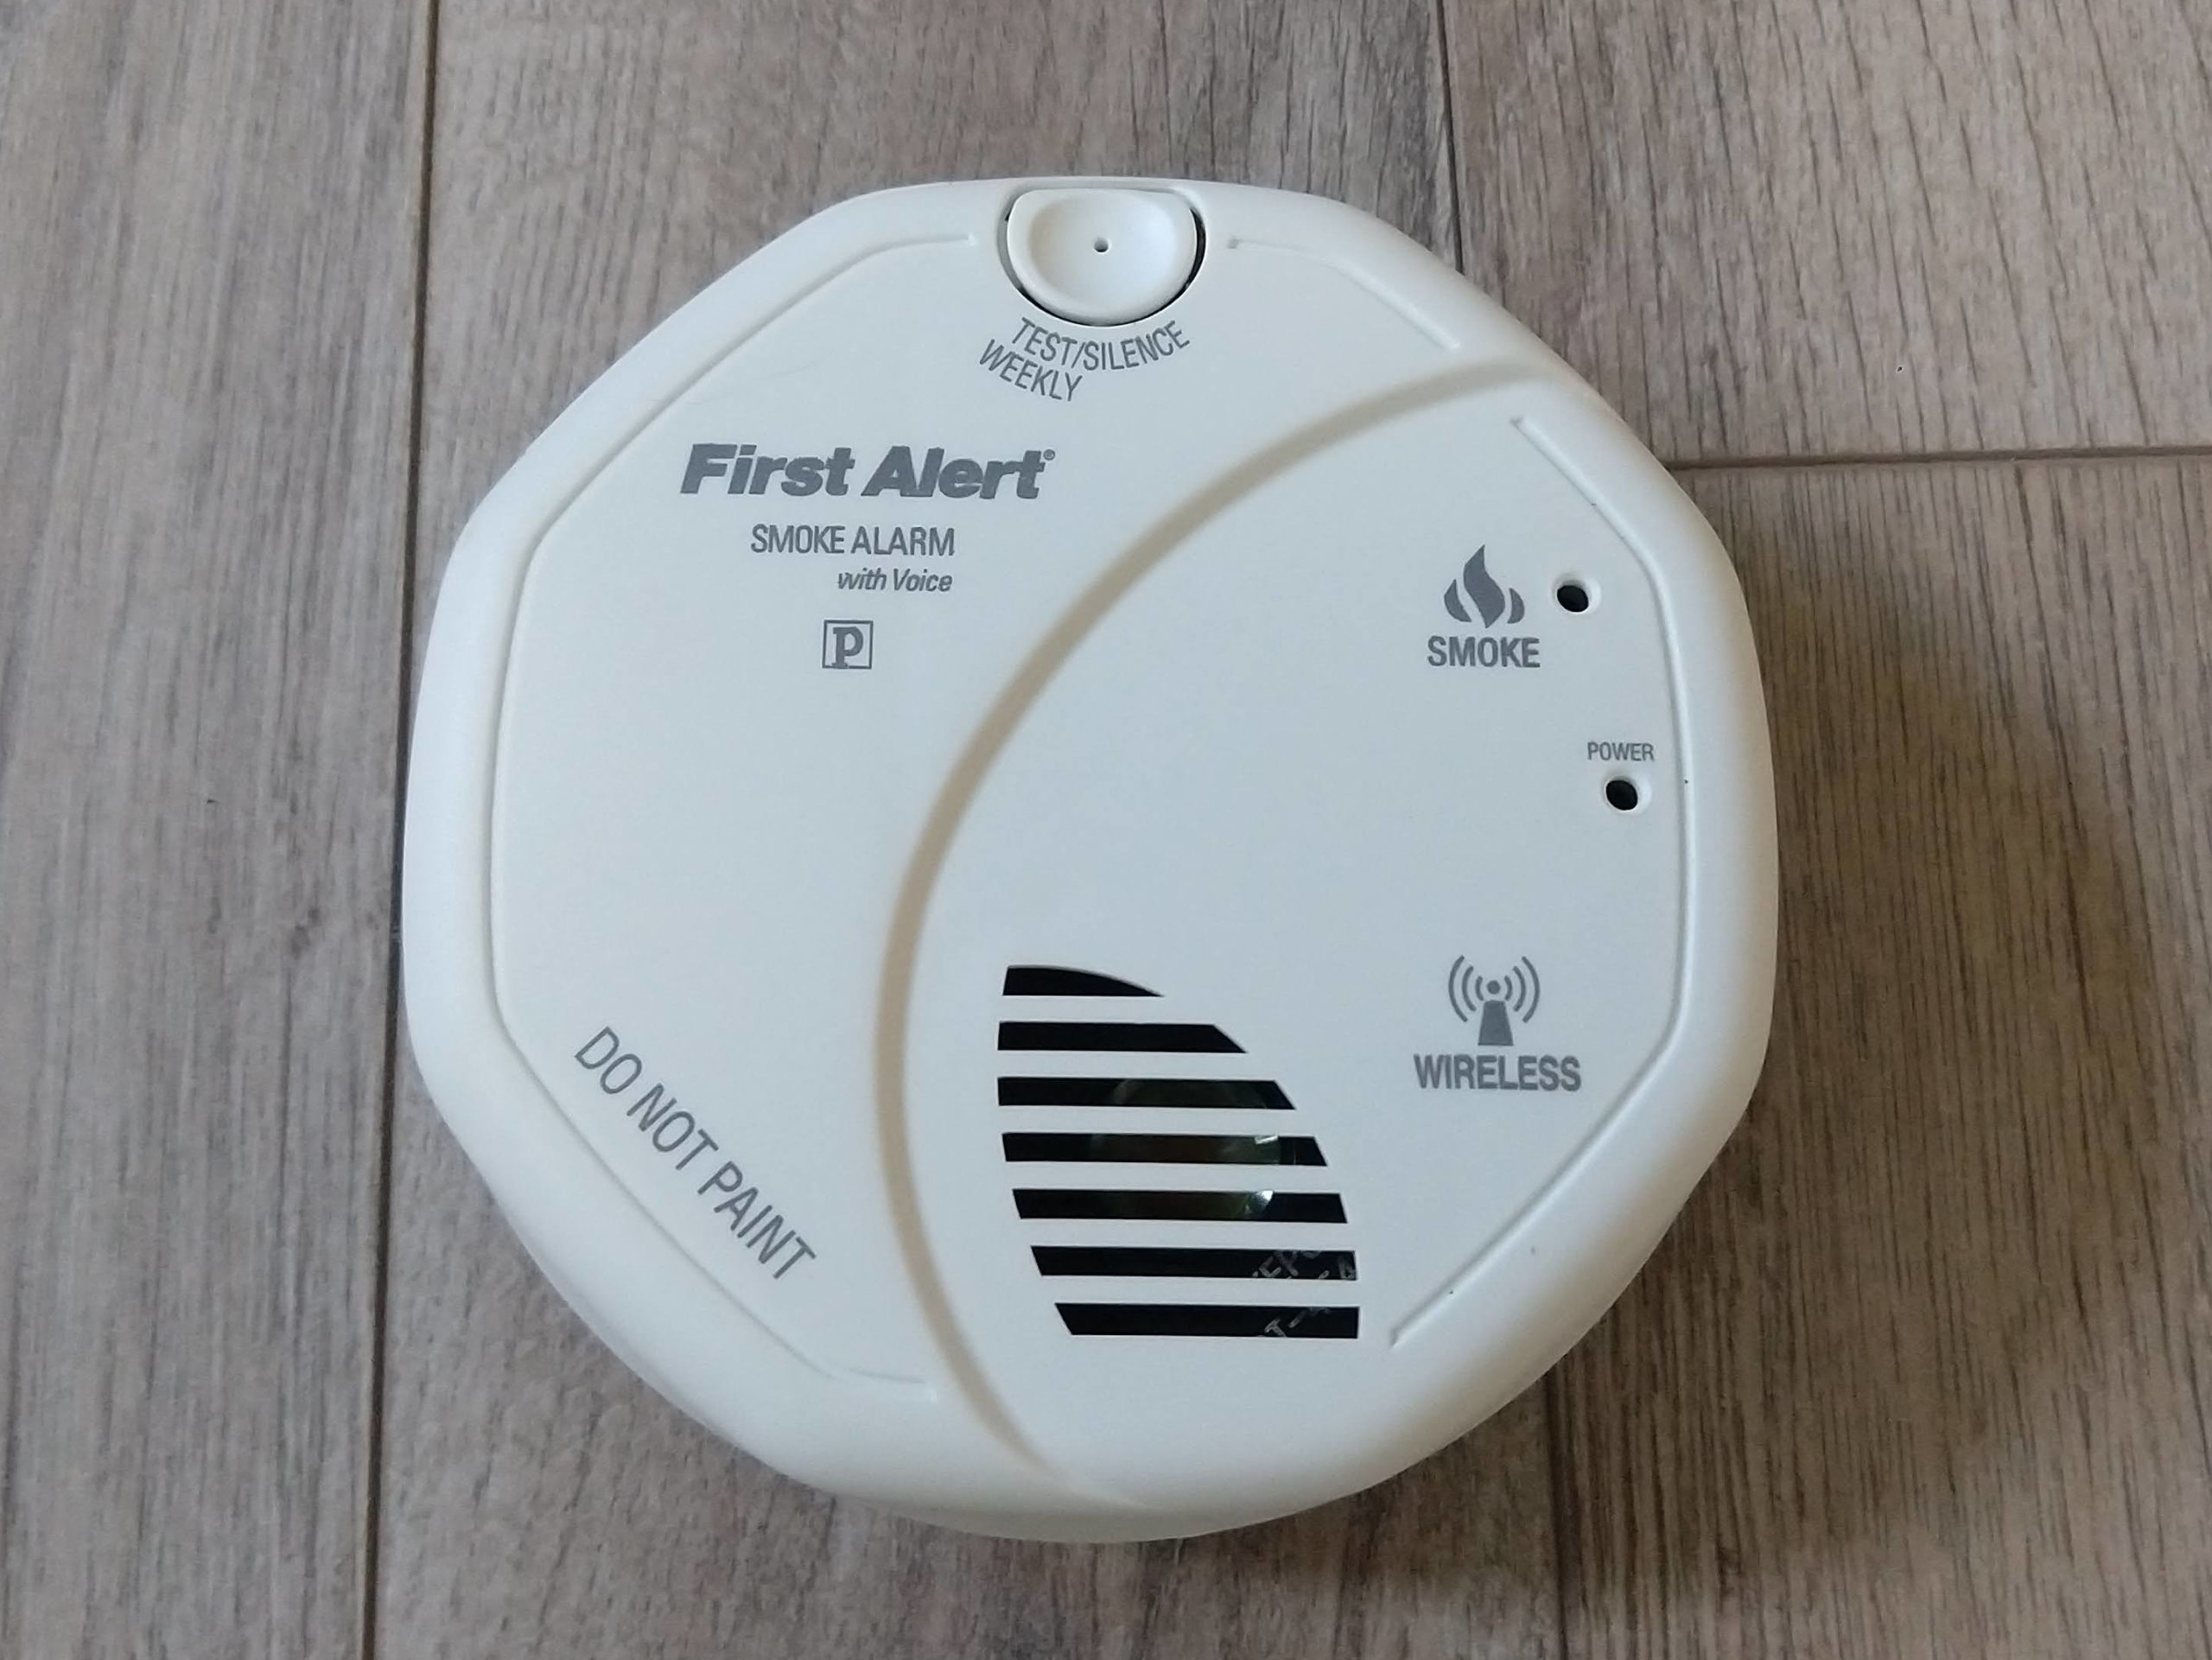
Remember how the handle on the front of my Glowforge’s glass lid fell off back in 2019? Well today when I went to lift the lid, the entire glass lid was detached from the back (hinges!). I am NOT impressed with the adhesive that Glowforge used on this unit.
Last time I was able to simply epoxy the handle back into place. I’m hopeful I can do the same thing for the back of the lid, but unfortunately this time it will be very important that I be able to get the lid as close to possible to the original position, as the calibration of the under-lid camera may be negatively impacted by any offsets. On the plus side, since my last issue, Glowforge has introduced a “beta” Calibrate Camera feature which should hopefully give me the ability to re-calibrate the under-lid (wide angle) camera “in the field”.
Somebody on the Glowforge community forums suggested that they had used E6000 (a flexible adhesive) to repair their lid, so I decided to give that a shot. I made this choice based mostly on the fact that E6000 is a single part adhesive that comes in a squeeze tube with a nice nozzle for dispensing. Getting a good bead between the lid and the hinge mechanism was going to be a little tricky because the lid is still attached to the main unit by a flexible circuit board/wire and it wasn’t immediately clear how to detach the connector. (I was worried that getting 2-part epoxy between the two of them without spilling any would be difficult. In retrospect, I should have ordered one of those “mix in the nozzle” dispensers for the epoxy….).
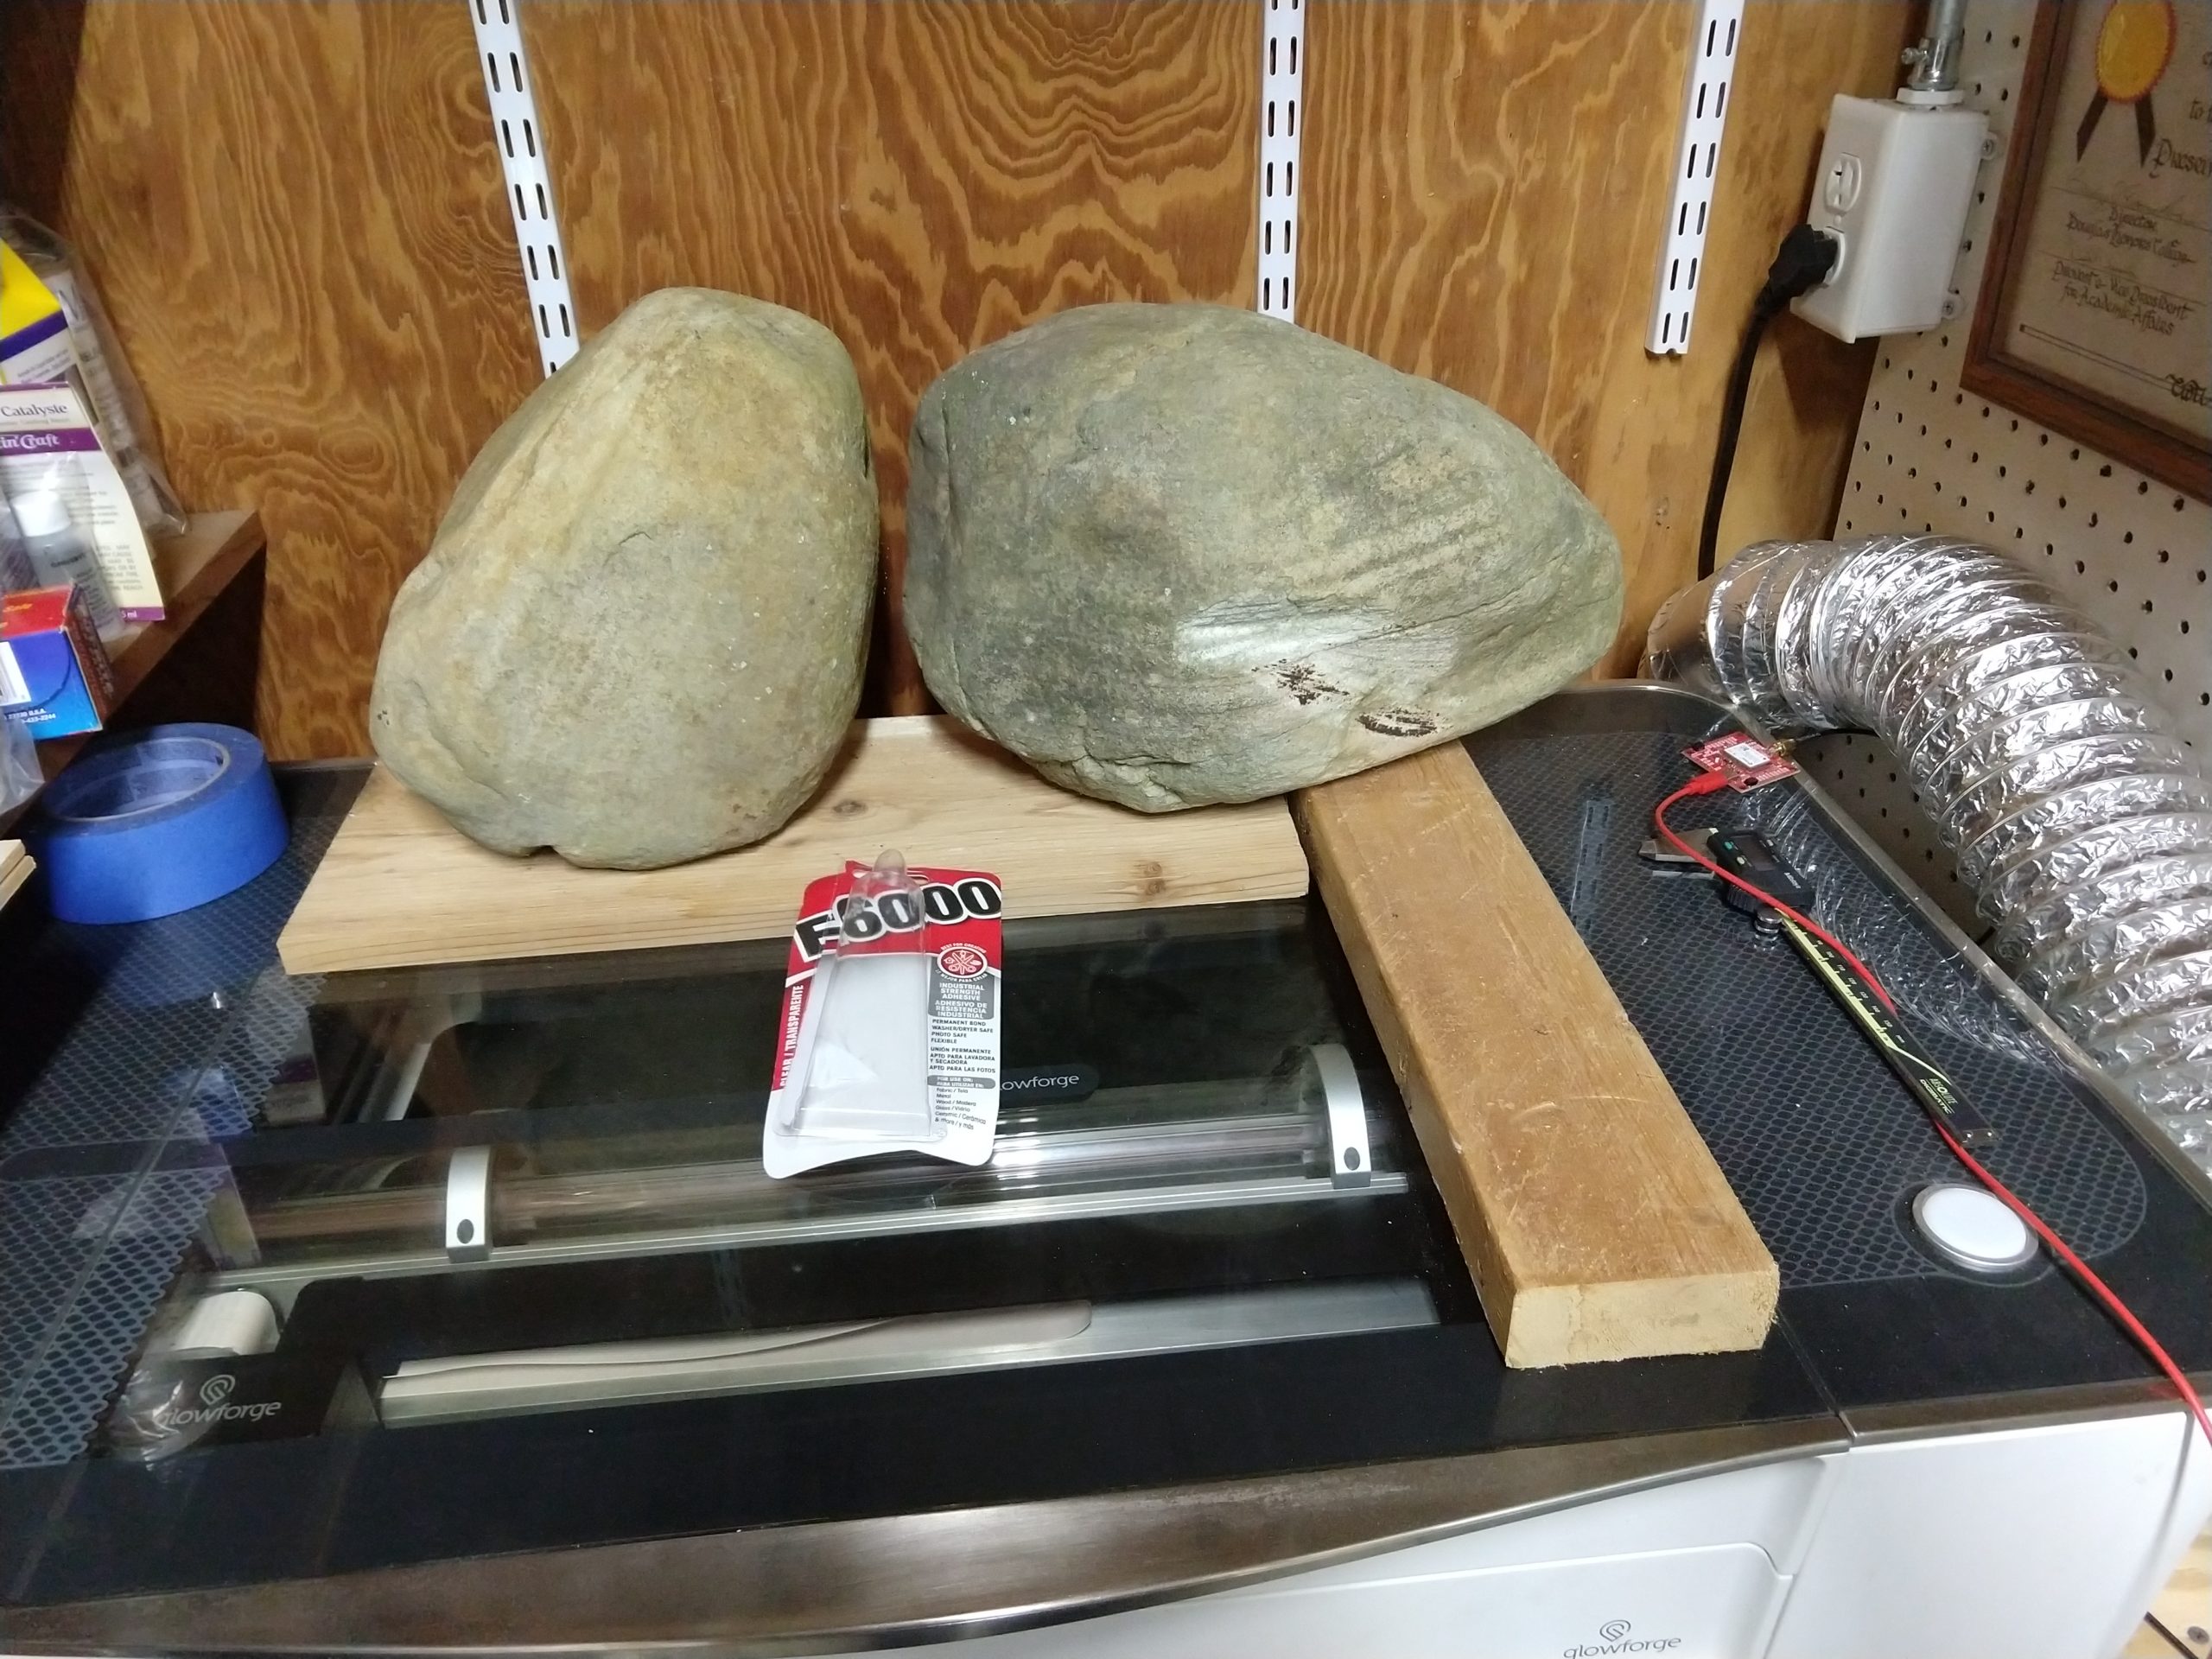
So, I laid down a few beads of E6000 and then clamped the lid down onto the hinges for 48 hours.

Clamping force provided by gravity.
When I opened the lid, the E6000 mostly held, but there was a noticeable “glue stretching” sound, and the right hand side of the lid (nearest the flexible wire, and hardest to get the nozzle under) detached. The E6000 was holding the lid on the hinge in an upright orientation, but I didn’t want to risk closing and opening the lid more.
So I ended up using JB Weld Clear 2 part 5 minute epoxy all along the edge of the lid and the hinge mechanism (using a toothpick to push it down in the gap on the right hand side) and then clamping the lid to the hinge in an upright position (using a real clamp this time) for another 24 hours.
The Epoxy is currently holding the lid onto the hinge very solidly. I’d feel better if I’d used epoxy between the entire lid and hinge mechanism, instead of just the edge and what I could force down the crack on the right hand side, so I’ll be gentle with the lid (but then again, I’ve been gentle with it ever since the handle fell off….)
I’m hopeful the bond will remain at least as permanent as my repair on the handle has so far.
Update: My laser tube gave up the ghost, and GlowForge exchanged my (well out of warranty) unit for a Refurbished one for $500. (Yes, they were informed about my lid repair activities with Epoxy and approved the exchange anyways…..)