EGO 7.5AH Battery degradation over time (3 year mark)

I log how much power it takes to charge my Ego batteries after I use them. I’m using this as a stand-in for how much capacity they retain over time. You should know that I have a large lawn (in Florida) and cycle these batteries at least once a week (more in the summer) so these batteries are getting more of a workout than if you had a small city lot that you could mow a few times before charging the battery.

I have two 7.5 AH batteries (one bought before the other). They took 410 watt hours to recharge when new.   My older battery has three years of use, and has 63% of it’s original capacity (260 w/h).     The drop from year 2 to year 3 was from 75->63% [The batteries have a 3 year warranty, so the first battery is now out of warranty.]

My second battery appears to be following the same general trajectory, although it’s capacity is just slightly less than the first battery (at the same years in service mark).

For the bar chart above I averaged the capacity of all measurements in a particular year, but if you graph all measurements you can see that they are generally decreasing over time (although the batteries do sometimes go “up” in capacity, possibly due to ambient temperatures).   The following graph is for my 2nd 7.5AH battery (manufacture date of 2018).

First Alert Smoke Alarm with Voice SA511 short service life (Malfunction signal)

In 2017, I purchased six First Alert Smoke Alarms with Voice (Model SA511) for our house. These are battery powered units that run for about a year before the 2 AA’s need to be replaced.

Sometime in the past   (late 2018? 2019?) one of them kept false alarming, and no amount of compressed air, battery changes, resetting, etc would keep it from alarming, so after several calls to First Alert, they replaced it under warranty.

More recently, (in June 2020 and November 2020) the units in my garage and utility room off of the garage both failed with a “Detector Error in <location>. Check Manual” error message (followed by three short “berrps” in rapid succession).

Continue reading

Lenovo Smart TAB M10 does not work with WPA2 and Android 9

To summarize why I do not recommend buying a Lenovo Android tablet:

  1. Their Android 9 software update borked WPA2 support.
  2. Instead of figuring out the (software) problem and fixing it, they instead instruct their customers to downgrade the security of their wifi.
  3. If that doesn’t work, they RMA the tablet and flash an older (insecure) version of android on it, and disallow software updates.

Continue reading

October 28th 2020: Orange County Florida COVID-19 Report

It’s October 28th, 2020, how is Orange County Florida doing with COVID-19?

The rate of decline in new cases had grown sluggish at the end of August, plateaued and then had a slight rise in September, and continues to be on a slight upward trend in October. Orange County is averaging 224 confirmed new cases per day over the last two weeks (compared to 147 in the same period in September). Compared to an average of 14 new cases per day in the first two weeks of April, the number of people infected each day is 16 times higher than in April.

We had 105 people die from Covid-19 in Orange County in the last month (slightly worse than the 79 in the prior month) and the total death count is at 549. Continue reading

Giving away public Wifi with DD-WRT and VPN

Cliff Notes for setting up a public (unencrypted) wifi hotspot to give free internet to guests with minimal risk to “your” network.

Sometimes it’s nice to give people free wifi, especially if you have more bandwidth than you normally use. However, you don’t want random people being able to access your network (or their random network activity to be traced TO your network….)   This is my set of notes for how to set up a 2nd wifi router (which must support the DD-WRT firmware) to act as a free wifi hotspot to untrusted guests.
Continue reading

August 27th 2020: Orange County Florida COVID-19 Report

It’s August 27th, 2020, how is Orange County Florida doing with COVID-19?

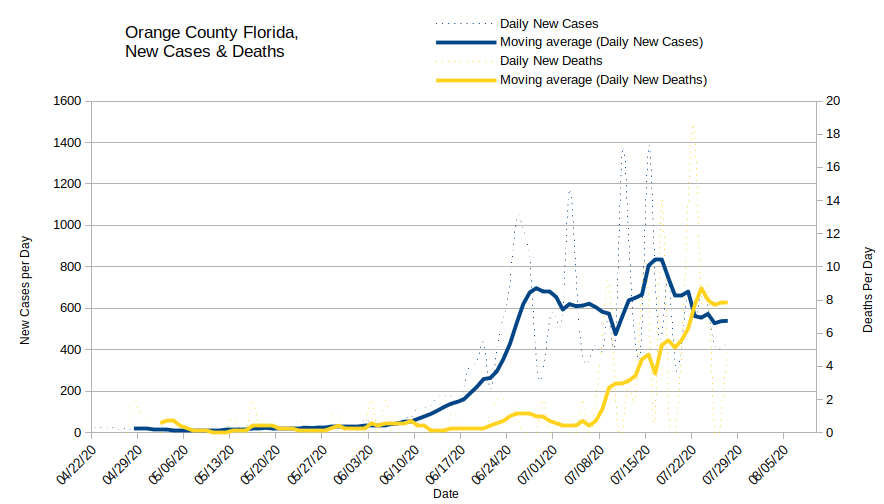
The number of new cases per day has seen steady decreases since late July, possibly due to a mandatory mask ordinance.   The rate of decline has grown sluggish for the last two weeks and the number of daily cases is still ten times that recorded in April. Orange County is averaging 191 confirmed new cases per day over the last two weeks, compared to an average of 14 new cases per day in the first two weeks of April.

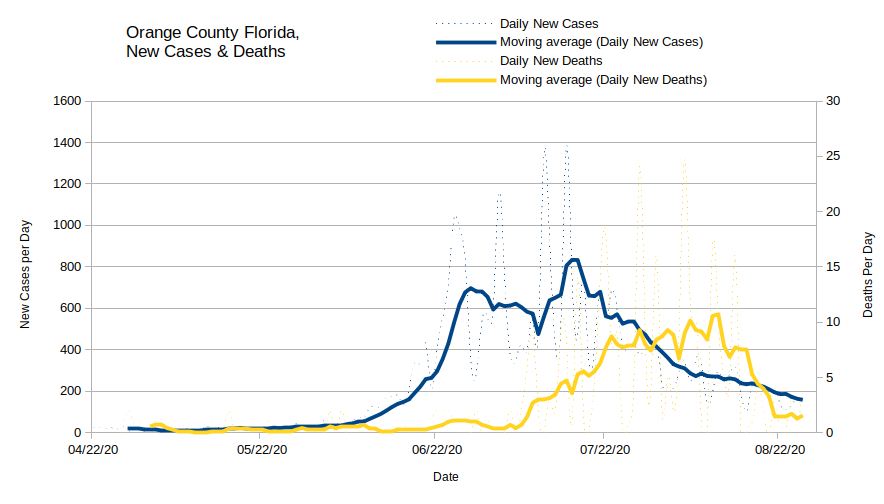
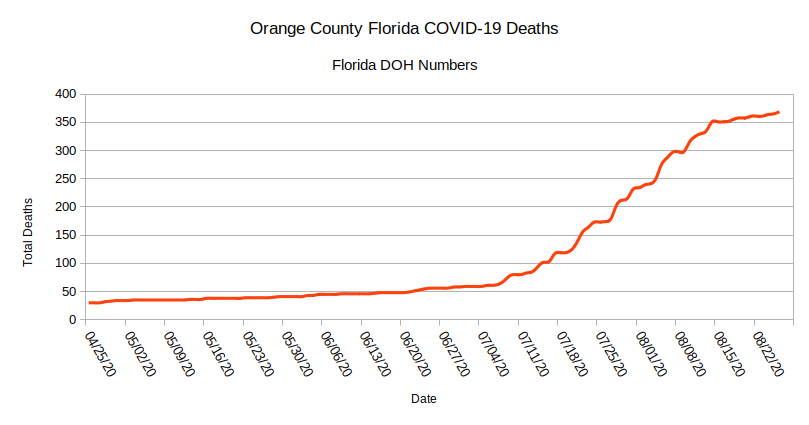
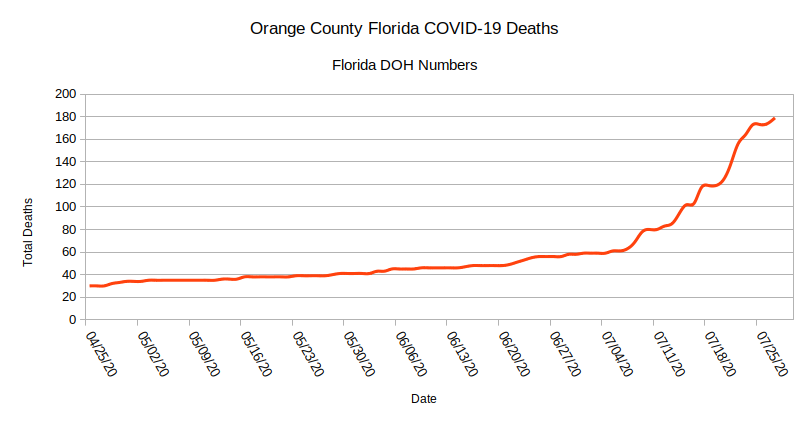
Deaths are lagging new cases by about 3 weeks and as the number of new cases have declined, the rate of deaths has also declined, averaging only 3 per day in the last two weeks.   Unfortunately, the total number of deaths in Orange County has gone from 179 on July 27th to 369 today (adding 190 deaths), a doubling of total deaths in the last month.

If the new deaths curve is actually lagging the new cases curve by 3 weeks, and also plateaus at the current levels, we will have a sustained period of 5-8 deaths per day for the next month, doubling the total number of deaths to date in the next month. [My unfortunately correct prediction from last month.]

A Positive Sign
A positive sign is that the percent positivity rate on tests has hovered just above the 5% goal (and has actually been below 5% for 4 of the last 14 days), indicating that community spread is almost at a manageable level.

How many people have been infected

The US Census bureau estimated that Orange County Florida has a population of 1,393,452 people (July 1st, 2019).     The Florida Department of health reports today that 35,245 cases of COVID-19 (confirmed by either a positive PCR or Antigen test result) have occurred in Orange County so far.     That means at least 2.5 percent (35245/1393452   =.02529330) of the population has been infected.

The actual number is likely to be higher, as many infections are asymptomatic, or not confirmed with a lab test.   Robert Redfield, the director of the CDC estimates that the number of people actually infected may be up to 10 times higher than confirmed with lab tests, putting an upper bound of 25% of the population of Orange County as already having been infected.

How many people have been hospitalized or died

Of those confirmed infected, 1,089 or 3 percent ( 1089 / 35245 = .0309) have been hospitalized, and 369 have died.   The death toll is currently 1 percent of all detected cases (369 / 35245 = 0.0104695701 ).

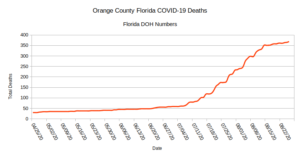
In the last month (July 27th to August 28th) the number of dead has doubled (from 179 to 369).

Florida average percentages for hospitalizations and deaths are 6.2% and 1.8% so Orange County has fared better than the rest of the state of Florida for hospitalizations and mortality so far.

Median Age is holding steady

Last month the median age of those infected was 42 , and this has held relatively steady, as 37 was the median age over the last 7 days.   [The median age of Florida residents is 42.2 ]

However, Orange County schools have re-opened on Friday Aug 21st, with at least 30% of the students opting for in-person schooling. I would not be surprised to see a dip in the median age as school age children begin to be infected at school. Fortunately, young children vary rarely face serious consequences from infection, but they may drive an uptick in community spread leading to deaths in older adults.

[Charts/Numbers used can be found in this open document spreadsheet: orange_county_florida ]

July 28th 2020: Orange County Florida COVID-19 Report

It’s July 28th, 2020, how is Orange County Florida doing with COVID-19?

The number of new cases per day has surged up, but appears to have plateaued at an average of 606 new cases a day for the last month. Deaths appear to lag new cases by about 3 weeks and have reached a rate of 7-8 per day.

upward surge of new cases, laged by new deaths 3-4 weeks later

If the new deaths curve is actually lagging the new cases curve by 3 weeks, and also plateaus at the current levels, we will have a sustained period of 5-8 deaths per day for the next month, doubling the total number of deaths to date in the next month.

How many people have been infected

The US Census bureau estimated that Orange County Florida has a population of 1,393,452 people (July 1st, 2019).     The Florida Department of health reports today that 27,820 cases of COVID-19 (confirmed by either a positive PCR or Antigen test result) have occurred in Orange County so far.     That means at least 2 percent (27820/1393452   = 0.019964) of the population has been infected.

The actual number is likely to be higher, as many infections are asymptomatic, or not confirmed with a lab test.   Robert Redfield, the director of the CDC estimates that the number of people actually infected may be up to 10 times higher than confirmed with lab tests, putting an upper bound of 20% of the population of Orange County as already having been infected.

How many people have been hospitalized or died

Of those confirmed infected, 756 or 2.7 percent ( 756 / 27820 = 0.02717469 ) have been hospitalized, and 179 have died.   The death toll is currently 0.64 percent of all detected cases (179 / 27820= 0.00643421).

Graph of deaths in OC Florida to date 179 total

In the last month (June 27th to July 27th) the number of dead has tripled (from 56 to 179).

Median Age is Increasing

Florida average percentages for hospitalizations and deaths are 5.6% and 1.38% so Orange County has fared better than the rest of the state of Florida for hospitalizations and mortality so far.   This may be due to the fact that South Florida was hit hard first, giving Central Florida a stark warning and time to prepare.

Unfortunately, the median age of the infected is rising. The first big surge of cases detected in mid-June (after bars reopened) were primarily very young individuals, with a median age of 22 for new cases. The current median age is 42, a generation older. As more older individuals are infected the percentages for hospitalizations and deaths may increase in Orange County to match the averages seen in the rest of Florida.


[Charts/Numbers used can be found in this open document spreadsheet: orange_county_florida.ods ]


Excess Deaths in the beginning of 2020

The CDC has a page hidden relatively deeply on their website that plots “excess” deaths (deaths over the expected average) for each week. All those red plus marks are weeks with detected “excess” deaths.

Most of the excess deaths are attributed to Covid-19, but there have also been some excess deaths attributed to other issues besides Covid-19. For example, more people than average are dying attributed to Alzheimer’s and Dementia:

Heart diseases:

And Diabetes:

This may be because people are avoiding hospitals and dying at home from problems that could have been survivable if they had gone to a hospital, or it could be due to issues with undetected infections.

Similar trends are occurring worldwide. If you are interested in knowing the “excess deaths” for your particular US state, the Washington Post has a nice interactive graph here.
Florida numbers look like this:

High Accuracy GPS with RTK in Orlando

Global Navigation Satellite Systems (GNSS)   receivers have made incredible improvements over the last twenty years. I remember having to stand outside for 10 minutes waiting for a US only Global Positioning System (GPS) receiver to lock onto 4 satellites so that I could get a fix with less than 100m accuracy (due to selective availability).   Now, you can buy a $220 GNSS receiver that can track 60 satellite channels simultaneously, start from cold in 25 seconds, lock into signals from satellites launched by four different countries (the USA, Russia, European Union, and China) and gets 2.5 to 5 meter accuracy all on it’s own without correction signals.

Here is a plot of the calculated location for a stationary antenna over time without correction signals (3D fix mode):

GPS location wondering around a 1m accuracy circle
As you can see, all of the readings are within a 1 meter circle of accuracy, which is quite good for finding your location on earth, but not (quite) accurate enough to drive a robotic lawnmower around and miss the petunias. [And from day to day you may be off by a few more meters…]
Continue reading

Build an 8×8 play structure with dimensional lumber

How to build an 8×8 play structure out of dimensional lumber.

8 foot by 8 foot play structure around a tree

360 view of the play structure. – Spherical Image – RICOH THETA

List of materials and tools for the basic structure (part 1)

Lumber:

  • 4x Pressure Treated (Ground Contact) 4×4 posts, 12′ long (8′ or 10′ possible for shorter platforms)
  • 2x Pressure Treated 2×8 beams, 8′ long
  • 9x Pressure Treated 2×6 Joists, 8′ long (possibly 10 or 11 needed if building box around a tree)
  • 6-8x Pressure Treated 2x4s (6 required for fancy corner braces and assembly bracing, but 8 suggested to make things easier. A few small pieces of scrap 2×4 are very useful for temporarily shelves to hold up boards if you are working alone.)

Hardware:

  • 12x 5/8″ galvanized lag bolts, 4″ long – mounting beams to 4×4 posts
  • 8x 5/16″ galvanized lag bolts, 4″ long – mounting end joists to 4×4 posts
  • 16x galvanized joist hangers (may need more if boxing the tree)
  • 100x 1.5″ galvanized structural screws – joist hangers to beams (can be replaced with 9 gauge galvanized nails if disassembly is not anticipated)
  • 100x 2.5″ galvanized structural screws – joists to beams (can be replaced with galvanized nails)
  • 1lb box of 3″ deck screws (used for attaching bracing together and temporarily mounting beams/joists, not actually part of the finished play structure)
  • Water sealing wood stain (to color/preserve the wood)

Tools Required:

  • Digging tools: Shovel & Post Hole Digger (+ clippers to cut small roots)
  • Wheelbarrow or other way to transport dirt and mix concrete
  • Hoe or concrete mixer, razor knife to open concrete bags
  • Cordless Drill, drill bits, screw drivers
  • Framing Level (4′ or longer suggested), large framing square
  • Tape Measure & pencil,
  • Metal rod (probe for roots), spraypaint or pegs to mark digging locations
  • Adjustable Wrench and/or ratchet driver and sockets for lag bolts
  • Hammer for setting the joist hangers and “persuading” joists into position.
  • Step ladder if you are building a tall platform, or are short.
  • Brush or sprayer for applying wood stain.

List of materials and tools for the flooring and corner braces (part 2)

  • 2x 4×8 exterior grade plywood (for floor)
    or
  • 17x 5.5″ composite deck boards (for floor)
  • 2 lbs of 2″ deck screws
  • Circular saw to clean up the edges of the deck boards (if used)
  • 4x-6x Pressure Treated 2x4s (8′ long) for the corner braces
  • Miter Saw (chop saw), circular saw, or hand saw (for simple corner braces)
  • Compound miter saw (if doing fancy corners)
  • 8x 5/16″ galvanized lag bolts (3″ long) for corner brace to beam/joist connections
  • 8x 5/16″ galvanized lag bolts (4″ long) for corner brace to 4×4 post connections
  • Premium waterproof wood glue for corner brace assembly
  • 2.5″ galvanized nails (or extra 2.5″ structural screws) for corner brace assembly


2×4 Basics Bench Brackets

I used 10 2×4 basics bench brackets to add bench/walls to 2 sides of the play structure. They come with all of the hardware you need, but I also purchased/used the following lumber for the bench seats & backs:

6x   2x6x10 Pressure Treated boards for seats & top-rail.
6x 2x4x10 Pressure Treated boards for back rests.

[an additional 4x 2x4x10 pressure treated boards are needed if you want to include the bottom safety rails.]

If you have a VR headset, or just want to wave your phone around in the air, you can watch this 360 video of my son running through the play structure:


I used OpenScad to mock-up the basic design to determine what lumber to buy for the basic platform and visualize what it would look like. You can download it here: plan_boxtree.scad